Performance of Lactation 1 cows

Associations between the % of lactation 1 cows achieving ≤75% of mature cow milk yields and other key performance indicators
Dr Emma Holt (PAN Livestock Services Ltd)
KEY MESSAGE
As described in the NMR 500-Herds KPI Report for 2025, the % of lactation 1 cows failing to produce at least 75% of a mature cow milk yield increased from 2020 to 2025. First lactation milk yields have not kept pace with increases in mature cow yields.
Furthermore, the analysis of 2025 data presented here shows that herds which allow first lactation cows more time to grow and develop prior to first calving, and then retain mature cows for longer (as indicated by productive life and age at exit) have a smaller % of lactation 1 cows failing to produce at least 75% of a mature cow milk yield. However, this appears to be associated with lower mature cow 305 day yields in those herds, as well as slightly higher first lactation 305 day yields.
RESULTS
Herd demographics
Exit rate (%), exit rate within 100 days of calving (%) and age at exit (lactations) were not significantly associated with the % of lactation 1 cows achieving ≤75% of average 3rd(+) calver milk yields. But, productive life (days) and age at exit (days) were significantly associated (p < 0.05). Cows within herds whereby ≤10% of lactation 1 cows achieved ≤75% of average 3rd(+) calver milk yields had an average productive life of 1,450 days. Average productive life (days) broadly decreased as the % of lactation 1 cows achieving ≤75% of average 3rd(+) calver milk yields increased. Cows within herds whereby >70% of lactation 1 cows achieved ≤75% of average 3rd(+) calver milk yields had an average productive life of 1,039 days (Figure 1).

Figure 1. The association between productive life (days) and the % of lactation 1 cows achieving ≤75% of average 3rd(+) calver milk yields.
Age at exit (days) demonstrated the same pattern. Cows within herds whereby ≤10% of lactation 1 cows achieved ≤75% of average 3rd(+) calver milk yields had an average age at exit of 2,330 days. Average age at exit broadly decreased as the % of lactation 1 cows achieving ≤75% of average 3rd(+) calver milk yields increased. Cows within herds whereby >70% of lactation 1 cows achieved ≤75% of average 3rd(+) calver milk yields had an average age at exit of 1,865 days (Figure 2).
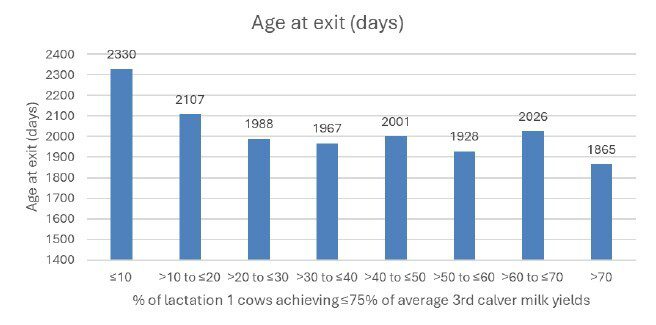
Figure 2. The association between age at exit (days) and the % of lactation 1 cows achieving ≤75% of average 3rd(+) calver milk yields.
Fertility
The % of cows pregnant 100 days after calving or not pregnant 150 days after calving were not significantly associated with the % of lactation 1 cows achieving ≤75% of average 3rd(+) calver milk yields. The % of service intervals which were 18 to 24 days apart, the % of cows served 80 days post calving, start of breeding to 1st service interval (days) and conception rate (%) were significantly associated with the % of lactation 1 cows achieving ≤75% of average 3rd(+) calver milk yields, but the trends were unclear. However, age at 1st calving (days) showed a clearer pattern. Age at 1st calving (days) broadly decreased as the % of lactation 1 cows achieving ≤75% of average 3rd calver milk yields increased. Cows within herds whereby ≤10% of lactation 1 cows achieved ≤75% of average 3rd calver milk yields had an average age at 1st calving of 894 days. Cows within herds whereby >70% of lactation 1 cows achieved ≤75% of average 3rd(+) calver milk yields had an average age at 1st calving of 824 days (Figure 3).

Figure 3. The association between age at 1st calving and the % of lactation 1 cows achieving ≤75% of average 3rd(+) calver milk yields.
Milk Production
As the % of lactation 1 cows achieving ≤75% of average 3rd(+) calver milk yields increased, the average lactation 1 and lactation 3+ 305-day milk yields significantly diverged. The average lactation 1, 305-day milk yield decreased from 7,619 kg to 6,081 kg and average lactation 3+, 305-day milk yield increased from 8,078 kg to 9,503 kg.
However, the associations between the % of lactation 1 cows achieving ≤75% of average 3rd(+) calver milk yields and the following KPIs were not significant; milk per cow per day of life (kg), milk per cow per year (kg), milk per cow per lactation (kg), 305-day milk yield (kg), average protein (%) and average fat (%).

Figure 4. Average lactation 1 and lactation 3+ 305-day milk yields compared to the % of lactation 1 cows achieving ≤75% of average 3rd(+) calver milk yields.
Somatic cell count (SCC)
Average SCC, the % of milk samples with a SCC >200,000 cells/ml or >500,00 cells/ml were not significantly associated with the % of lactation 1 cows achieving ≤75% of average 3rd(+) calver milk yields. However, from ≤10% to >30% to ≤40%, the % of cows dried-off with no SCC 200,000 cells/ml increased (Figure 5). This observation may be due to herds with a % of lactation 1 cows achieving ≤75% of average 3rd(+) calver milk yields typically containing more mature cows.

Figure 5. The association between the % of cows dried off with no SCC > 200,000 cells/ml and the % of lactation 1 cows achieving ≤75% of average 3rd(+) calver milk yields.
METHODS
Data for the % of lactation 1 cows achieving ≤75% of average 3rd(+) calver milk yields was grouped into the following categories (n); ≤10% (34), >10% to ≤20% (82), >20% to ≤30% (104), >30% to ≤40% (104), >40% to ≤50% (76), >50% to ≤60% (57), >60% to ≤70% (23) and >70% (20).
Kruskal-Wallis one-way analysis of variance was used to identify KPIs which were significantly associated with the % of lactation 1 cows achieving ≤75% of average 3rd calver milk yields. These were then plotted using Microsoft Excel.